Major conclusions for eCAMBer
Here we present results supporting the four major conclusions discussed
in our paper (submitted, 2013):
- eCAMBer significantly improves CAMBer running time
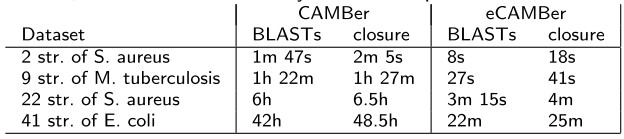
Comparison of running times between eCAMBer and CAMBer on four datasets from our previous work on CAMBer. All computations were executed on a desktop machine with 4 processor cores being used. The columns correspond in left-to-right order to: short detaset description, time consumed by BLAST computations in CAMBer during the closure procedure, total time consumed by the closure procedure in CAMBer, time consumed by BLAST computations in eCAMBer during the closure procedure, total time consumed by the closure procedure in eCAMBer. - eCAMBer scales well to large datasets comprising hundreds of bacterial strains
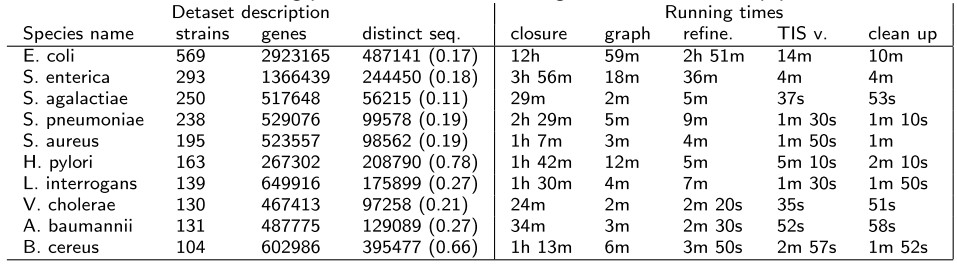
Here we summarize eCAMBer running times on ten large 10 available in the PATRIC ftp database. - eCAMBer improves annotation consistency
- eCAMBer improves the overall annotation quality
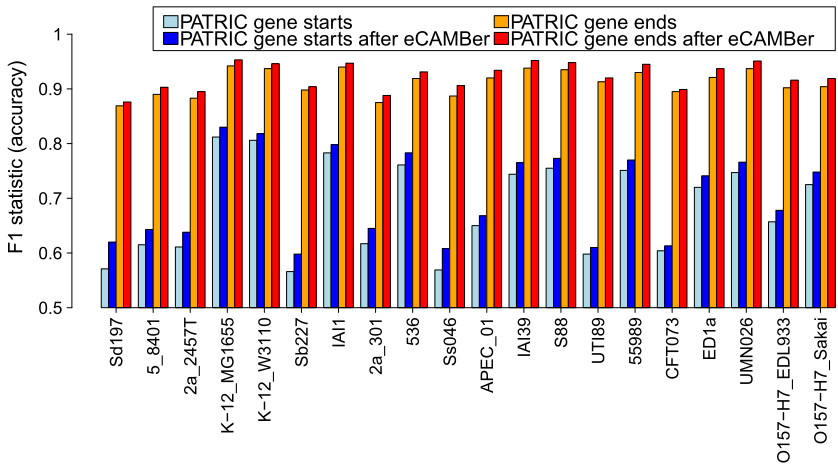
Comparison of annotation accuracy before and after applying eCAMBer on the dataset of 20 E. coli strains with annotations from PATRIC. Manually curated annotations from ColiScope were used as a gold standard.
Major conclusions for CAMBer
(also hold for eCAMBer)
-
There are high differences in the number of annotated genes. These differences
do not correspond to the genome sequence similarity among bacterial strains.
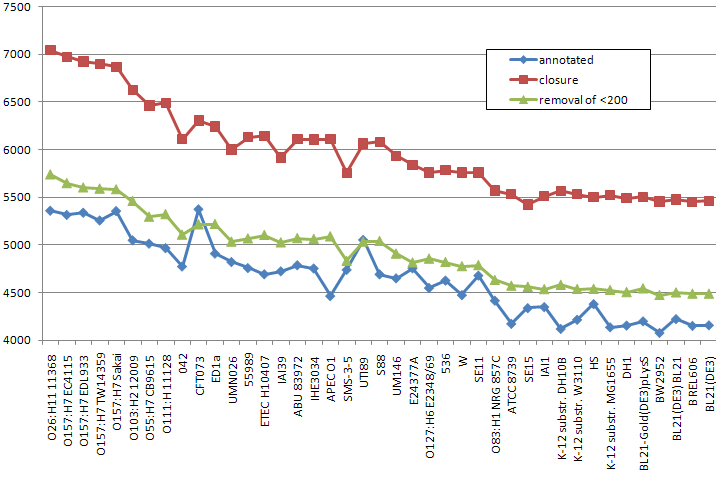
This plot presents numbers of annotated genes and numbers of the multigenes after the closure procedure applied to E. coli strains. On the x-axis strains are listed (from left to right) in descending order of their genome length. The blue line and the red line present respectively the number of annotated genes and the number of multigenes (after the closure) for each strain. The green line presents the number of multigenes after the closure and after applied post-processing removal of multigenes shorter than 200 nucleotides length. -
Estimations of the core-genome size based on only original annotations are underestimeted (see Figure 2).
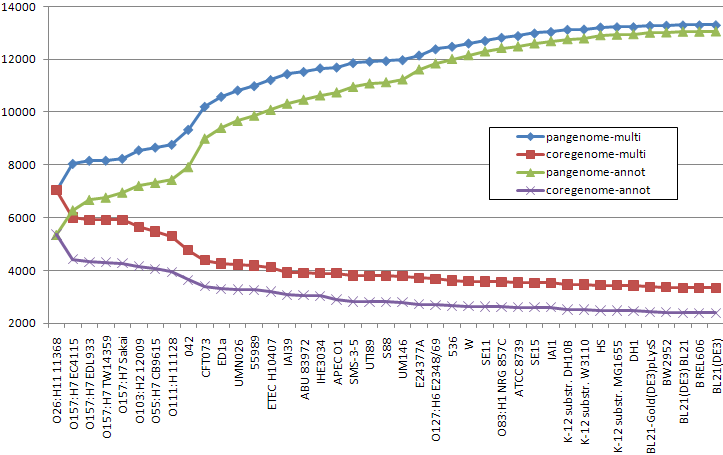
Core vs. pangenome plots of 41 E. coli strains calculated using original annotations and multigene annotations, predicted by CAMBer. Strains are sorted (from left to right) in descending order of their genome sizes. Violet and green (coregenome-annot and pangenome-annot) lines connect cumulative numbers of core and pangenome sizes using annotated genes, while red and blue (coregenome-multi and pangenome-multi) lines connect cumulative numbers of core and pangenome sizes using multigenes after the closure procedure. The proportion of core genome to pangenome size has risen from 18% to 25% after the closure.
Detailed results produced by CAMBer are available on the project website
CAMBer results for the E. coli case study
CAMBer results for the S. aureus case study: