Results
Two major corollaries of our study on genome annotation inconsistencies presented in examples on the E. coli case study from our publication in BMC genomics:- There are high differences in the numbers of annotated genes, which don't correspond to the real genome similarity among bacterial strains (see Figure 1).
- Estimations of the core-genome size based on only original annotations are underestimeted (see Figure 2).
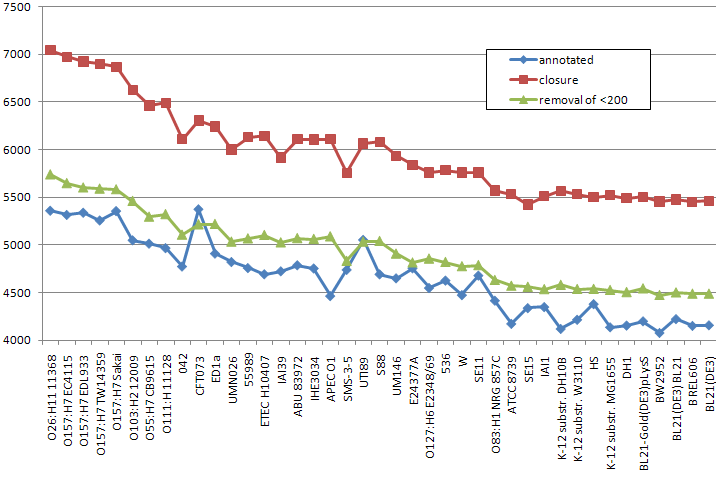
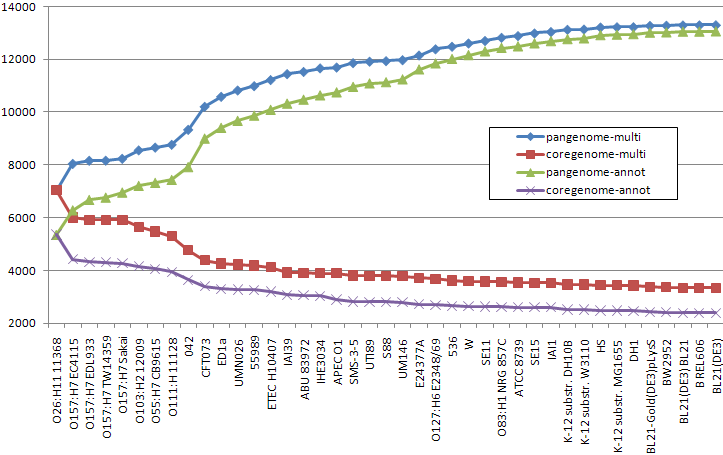
Figure 2: Core vs. pangenome plots of 41 E. coli strains calculated using original annotations and multigene anno- tations, predicted by CAMBer. Strains are sorted (from left to right) in descending order of their genome sizes. Violet and green (coregenome-annot and pangenome-annot) lines connect cumulative numbers of core and pangenome sizes using annotated genes, while red and blue (coregenome-multi and pangenome-multi) lines connect cumulative numbers of core and pangenome sizes using multigenes after the closure procedure. The proportion of core genome to pangenome size has risen from 18% to 25% after the closure.
Detailed results
CAMBer results for the E. coli case study
CAMBer results for the S. aureus case study