Tav4SB project
Taverna services for Systems Biology
Contents
Contact
If you have any questions, comments or seek help with our WS or any other resource, please contact us via tav4sb discussion group or directly at tav4sb@mimuw.edu.pl.
Probabilistic model checking (PMC) of SBML stochastic model
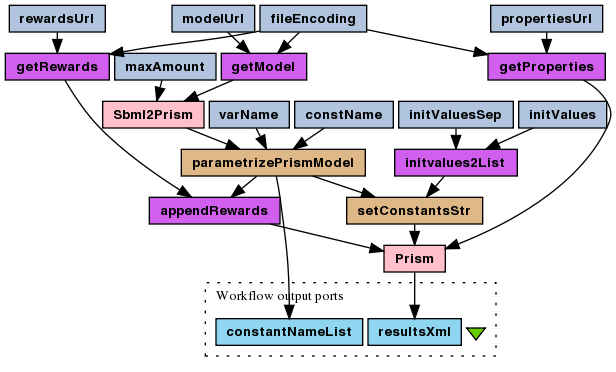
This is a probabilistic model checking experiment for the stochastic version of the enzymatic reaction model (SBML). The The reward-based CSL formula, which is being checked, asks the model about how many times, on average, the enzyme-substrate complex association reaction have to occur before amount of the product reaches 50% of its maximum? This is motivated by the half maximal effective concentration (EC50 coefficient). Question is asked for different enzyme initial amount to find its optimal efficiency. As the PMC is time consuming, the experiment is divided into "compute" and "plot" workflows, mainly because plotting usually requires many runs to fine-tune the plot parameters.
To run this experiment choose File > Open workflow location...
and copy-paste the link to the
"compute" workflow file. Then File > Run workflow...,
wait for results and from the Results perspective choose Save
all values > Save in single XML document. This workflow has no inputs
and all parameters to play around with are embedded in string constants
(modelUrl, constName, varName,
rewardsUrl, propertiesUrl,
initValues). Next, open and run
the "plot" workflow file.
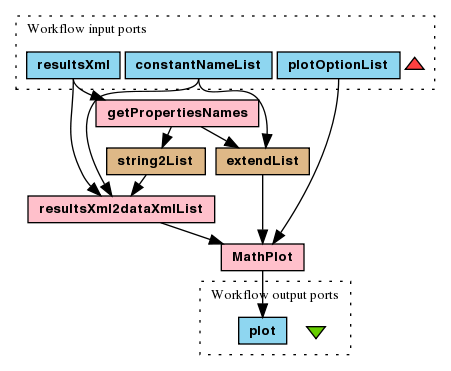
This time Taverna will ask for filling in the input values, so in the input
values dialog choose Load previous values and point to previously
saved "compute" values. The p_MAX PRISM model
parameter wont be interesting to plot, it is constant in our experiment.
Delete it from constantNameList input values. Fill in the plot
options list; Taverna requires at least one input value, so if you don't
know what to put in, put at least PlotLabel -> "".
Now you're all set to run the plotting workflow.
As a result you have the <results> XML element from
the computational part and an image of calculated formula values from the
plotting part. To obtain the following plot:
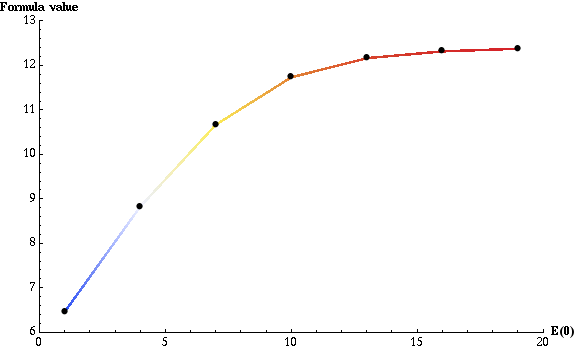
we used the following plot options:
AxesLabel -> { "E(0)", "Formula value" }
PlotLegend -> None
ColorFunction -> "TemperatureMap"
PlotRange -> {{0., 20.}, {6., 13.}}
MarkerColor -> Black
Note: for description of plotting options check mathPlot
WS operation
wrapper docs on
optionList input at myExperiment or
input docs at
BioCatalogue.
The plot can be read as: if E(0) is equal to 1, then, on average, before product reaches half of its maximum, each enzyme has to convert slightly more than 6 substrates. To no surprise, when E(0) is equal to 12 (the initial amount of substrate), each enzyme has to convert at most one substrate. The total, parallel enzymatic reaction system's efficiency doesn't improve significantly from that point as not much more than 12 complex formation reactions r1 are needed to achieve half of the maximum product amount.
Resources
Taverna 2 workflow files: