Predict overrepresented motif complexes in any genome-wide set of regulatory regions.
Contents
Citations
Jankowski A., Prabhakar S., Tiuryn J.: TACO: a general-purpose tool for predicting cell-type–specific transcription factor dimers. BMC Genomics 2014, 15:208.
Jankowski A., Szczurek E., Jauch R., Tiuryn J., Prabhakar S.: Comprehensive prediction in 78 human cell lines reveals rigidity and compactness of transcription factor dimers. Genome Res. 2013, 23:1307-18.
Contact
If you have any questions or comments, please contact Aleksander Jankowski.
TACO is actively developed; for the latest version, see github.com/ajank/taco.
Documentation
TACO, or Transcription factor Association from Complex Overrepresentation, is a program to predict overrepresented motif complexes in any genome-wide set of regulatory regions. TACO is a command line tool, and should be invoked with one argument: the name of the specification file to process.
Specification file
A specification file, usually with .spec extension, has a HTML-like structure. A hash sign (#) begins a comment. Sequences of whitespace will collapse into a single whitespace. All the declarations have a form of key=value pairs. In case multiple values are allowed, they may come as multiple key=value pairs, as well as multiple values separated by whitespace. All filenames may contain wildcards. Each declaration has block scope, i.e. is applicable only to the declarations within <section>...</section>. All the applicable sections are described below.Genome
The <Genome> section specifies the reference genome sequence file(s), and possibly set(s) of genomic regions to be masked (excluded from the analysis). The following keys may be used:- FastaFile
- FASTA file(s) containing the genome sequences. Lowercase nucleotides (usually representing repetitive regions) are masked.
- MaskedRegions
- BED file(s) listing regions to be masked, e.g. coding sequences.
Input datasets
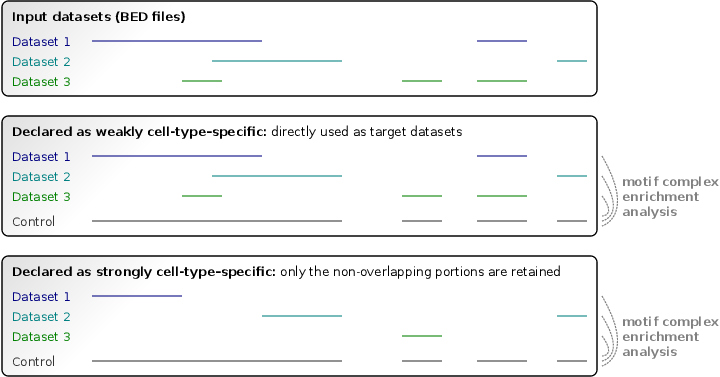
Input regulatory region datasets of two kinds are handled: strongly cell-type–specific or weakly cell-type–specific. Each input dataset should be declared as strongly or weakly specific (these two kinds can be provided simultaneously). They are specified in the <StronglySpecificDatasets> section(s) and <WeaklySpecificDatasets> section(s), respectively. We recommend treating open chromatin datasets (such as DNase-seq datasets) as strongly specific, and ChIP-seq datasets as weakly specific. Each input dataset may consist of multiple replicates in narrowPeak or BED format.
Strongly and weakly cell-type–specific datasets are translated using different approaches into target datasets for TF dimer prediction. Regulatory regions of strongly specific datasets are intersected with each other, and only the non-overlapping (unique) portions are retained as target regions. In contrast, the weakly specific datasets are directly used as target datasets, without modification. The union of all replicates sharing a dataset identifier will be taken as a single input dataset. The union of all input datasets is used as a control dataset in order to build the null model of motif complex occurrence.
The following keys may be used to specify input datasets:
- Dataset
- Replicate filename, optionally preceded by the dataset identifier and whitespace. If no dataset identifier is provided, the replicate filename is taken.
- DatasetList
- File(s) containing a list of datasets specified as above, in subsequent lines.
- RegionSize
- Set each region size to a given value (in base pairs), centering at the peak. Default: 0 (leave it unchanged).
- RegionMasking
- Specify how the regions overlapping masked fragments of the genome (see MaskedRegions in <Genome> section) should be treated. One of the following:
- None
- no masking,
- Peak
- exclude a region if its peak position (as specified in narrowPeak file) is masked in the genome
- Majority
- exclude a region if most of the underlying genomic sequence is masked.
- RegionCount
- Consider not more than the given number of regions with top signalValue (as specified in narrowPeak file). Default: 0 (consider all).
Motifs
Motifs (position weight matrices) used in the analysis are specified in the Motifs section(s). Accepted formats include: TRANSFAC, JASPAR, SwissRegulon and MEME output (in PSPM format, including the line starting with letter-probability). Although more than one motif database may be provided, it will be usually not necessary.
Motif identifiers are read along the position weight matrices. The uniqueness of the identifiers is enforced by suffixing them with underscore (_) and subsequent numbers if necessary. If no identifier is provided, motif filename is used instead. The following keys may be used:
- Database
- Motif database file(s).
- DatabaseSubset
- File(s) listing identifiers of motifs from the motif database(s) to be included in the analysis. If not provided, all the motifs from all motif databases are used.
- Motif
- Motif filename, optionally preceded by the dataset identifier and whitespace.
- Sensitivity
- Sensitivity value used for setting motif score threshold. Default: 0.9.
Scope of the analysis
The set of motif complexes or datasets considered in the analysis may be narrowed down in the <Scope> section(s). The following keys may be used:- Motif1
- Motif identifiers for one of the motifs forming up the motif complex. Default: all motifs.
- Motif2
- Motif identifiers for the other motif forming up the motif complex. Default: all motifs.
- Dataset
- Identifiers of the target datasets to consider. Default: all datasets.
Various options
In the <Options> section, the following keys may be used:- NumberOfThreads
- Number of simultaneously running threads. Should be not more than the number of CPU cores of the machine. Default: 1.
- MinMotifInformationContribution
- Minimal information contribution of each of the motifs forming up the motif complex. Default: 6.0.
- MaxOverlappingInformationContent
- Maximal overlapping information content allowed in the motif complex. Default: 2.0.
- MaxMotifSpacing
- Maximal spacing between the motifs forming up the motif complex. Motif spacing is defined as the number of intervening base pairs between the edges of the two contributing motifs; negative values indicate motif overlap. Default: 50.
- ConsiderOrientationsSeparately
- Whether to calculate motif complex overrepresentation statistics separately for each of the two mutual motif orientations in a motif pair. One of: True, False. Default: True.
- ConsiderMostSignificantComplexOnly
- Whether to consider only the most significant motif complex structure for a motif pair. One of: True, False. Default: False.
- TargetInstancesThreshold
- Minimal number of instances in target dataset for an overrepresented motif complex not to be rejected. Default: 100.
- FoldChangeThreshold
- Fold change threshold. Default: 1.
- PValueThreshold
- p-value threshold, applied to p-values after Bonferroni correction. Default: 0.05.
- DimerMotifFlanks
- Number of flanking basepairs for dimer motifs. Default: 5.
- ClusteringAcrossDatasets
- Whether to allow prediction clusters to span across multiple datasets. One of: True, False. Default: True.
- ClusteringDistanceConstant
- Constant in the affine function for joining motif complexes by dimer motif similarity. Default: 0
- ClusteringDistanceMultiplier
- Multiplier in the affine function for joining motif complexes by dimer motif similarity. Default: 0.15
- ClusteringOverlapThreshold
- Overlap threshold for joining motif complexes by overlap of genomic instances. Default: 0.2
- OutputPrefix
- Prefix for all output files. Default: name of the specification file, after truncating trailing .spec if possible.
- OutputDetailedStats
- Whether to save detailed statistics for all motif complexes formed by pairs of motifs yielding an overrepresented motif complex. One of: None, Signature – only for signature motif complexes, All – for all overrepresented motif complexes. Default: All.
- OutputDimerMotifs
- Whether to save dimer motifs. One of: None, Signature, All. Default: All.
- OutputGenomicLocations
- Whether to save genomic locations of instances of overrepresented motif complexes. One of: None, Signature, All. Default: All.
- GenomicLocationsMaxSpacingDeviation
- Number of incorrect motif spacings to be considered while saving genomic instances. If greater than 0, genomic instances of incorrectly spaced variants of overrepresented motif complexes will be saved, with spacing deviation ranging between 1 and the given value. Default: 0.
- OutputPValueDistribution
- Whether to save p-value distribution, suitable for producing a Q-Q plot. One of: True, False. Default: True.
Output files
The following files are created as output, subject to the options discussed above:- <OutputPrefix>.tab
- all overrepresented motif complexes, clustered into predictions
- <OutputPrefix>.stats
- detailed statistics for all motif pairs yielding an overrepresented motif complex
- <OutputPrefix>.pwms
- dimer motifs in TRANSFAC format
- <OutputPrefix>.hits
- genomic locations of instances of overrepresented motif complexes, and possibly of their incorrectly spaced variants
- <OutputPrefix>.pval
- p-value distribution.
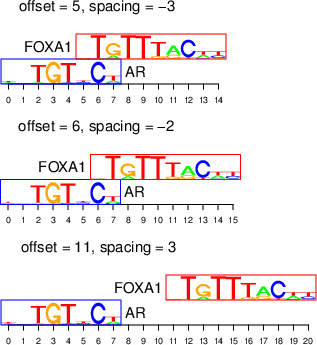
Note on terminology
We define the offset as the coordinate of the leftmost position of one motif in the coordinate system of the other motif (with zero-based start), and the spacing as the number of intervening nucleotides between the edges of the two motifs (see below). As described in the paper, we allow for overlapping motif complexes, which are characterized by negative spacing.