Results
- Detailed
description of the methodology of GWAMAR and its
results.
-
Chayaporn Suphavilai's (National University of Singapore)
report of results based on GWAMAR
- mtu173 case study
- Excel table with the list of associations
sorted according to the TGH score. This analysis is restricted only to the
genes known to be involved in drug resistance.
- mtu_broad case study
- Excel table with the list of
associations sorted by the TGH score. This analysis is restricted to
the genes known to be involved in drug resistance.
- Compensatory mutations
- This table presents the list of
putative compensatory mutations identified by our approach applied
to the mtu_broad and mtu173 datasets, identified in one of our two datasets
and also reported in at least one of the three recent articles, or reported in
at least two of the articles. The first two columns correspond to the gene
name, and the reference amino acid, respectively. The next three columns
provide brief descriptions of the mutations identified in the three recent
studies: by Comas et al. (2012), de Vos et al. (2013) and Casali et al.
(2014), respectively. The last two columns list the mutations identified based
on our two case studies. Each mutation's description comprises of the
reference amino acid, the position of the mutation in the gene, and different
amino-acid variants of the mutation among the strains. For each mutation, the
lower indexes indicate the number of strains, in the corresponding dataset,
possessing the corresponding amino-acid variant of the mutation.
- This table presents the complete
list of identified putative compensatory mutations to rifampicin, put together
with the putative compensatory published in other recent articles. Mutations
marked in red are in the RRDR in rpoB.
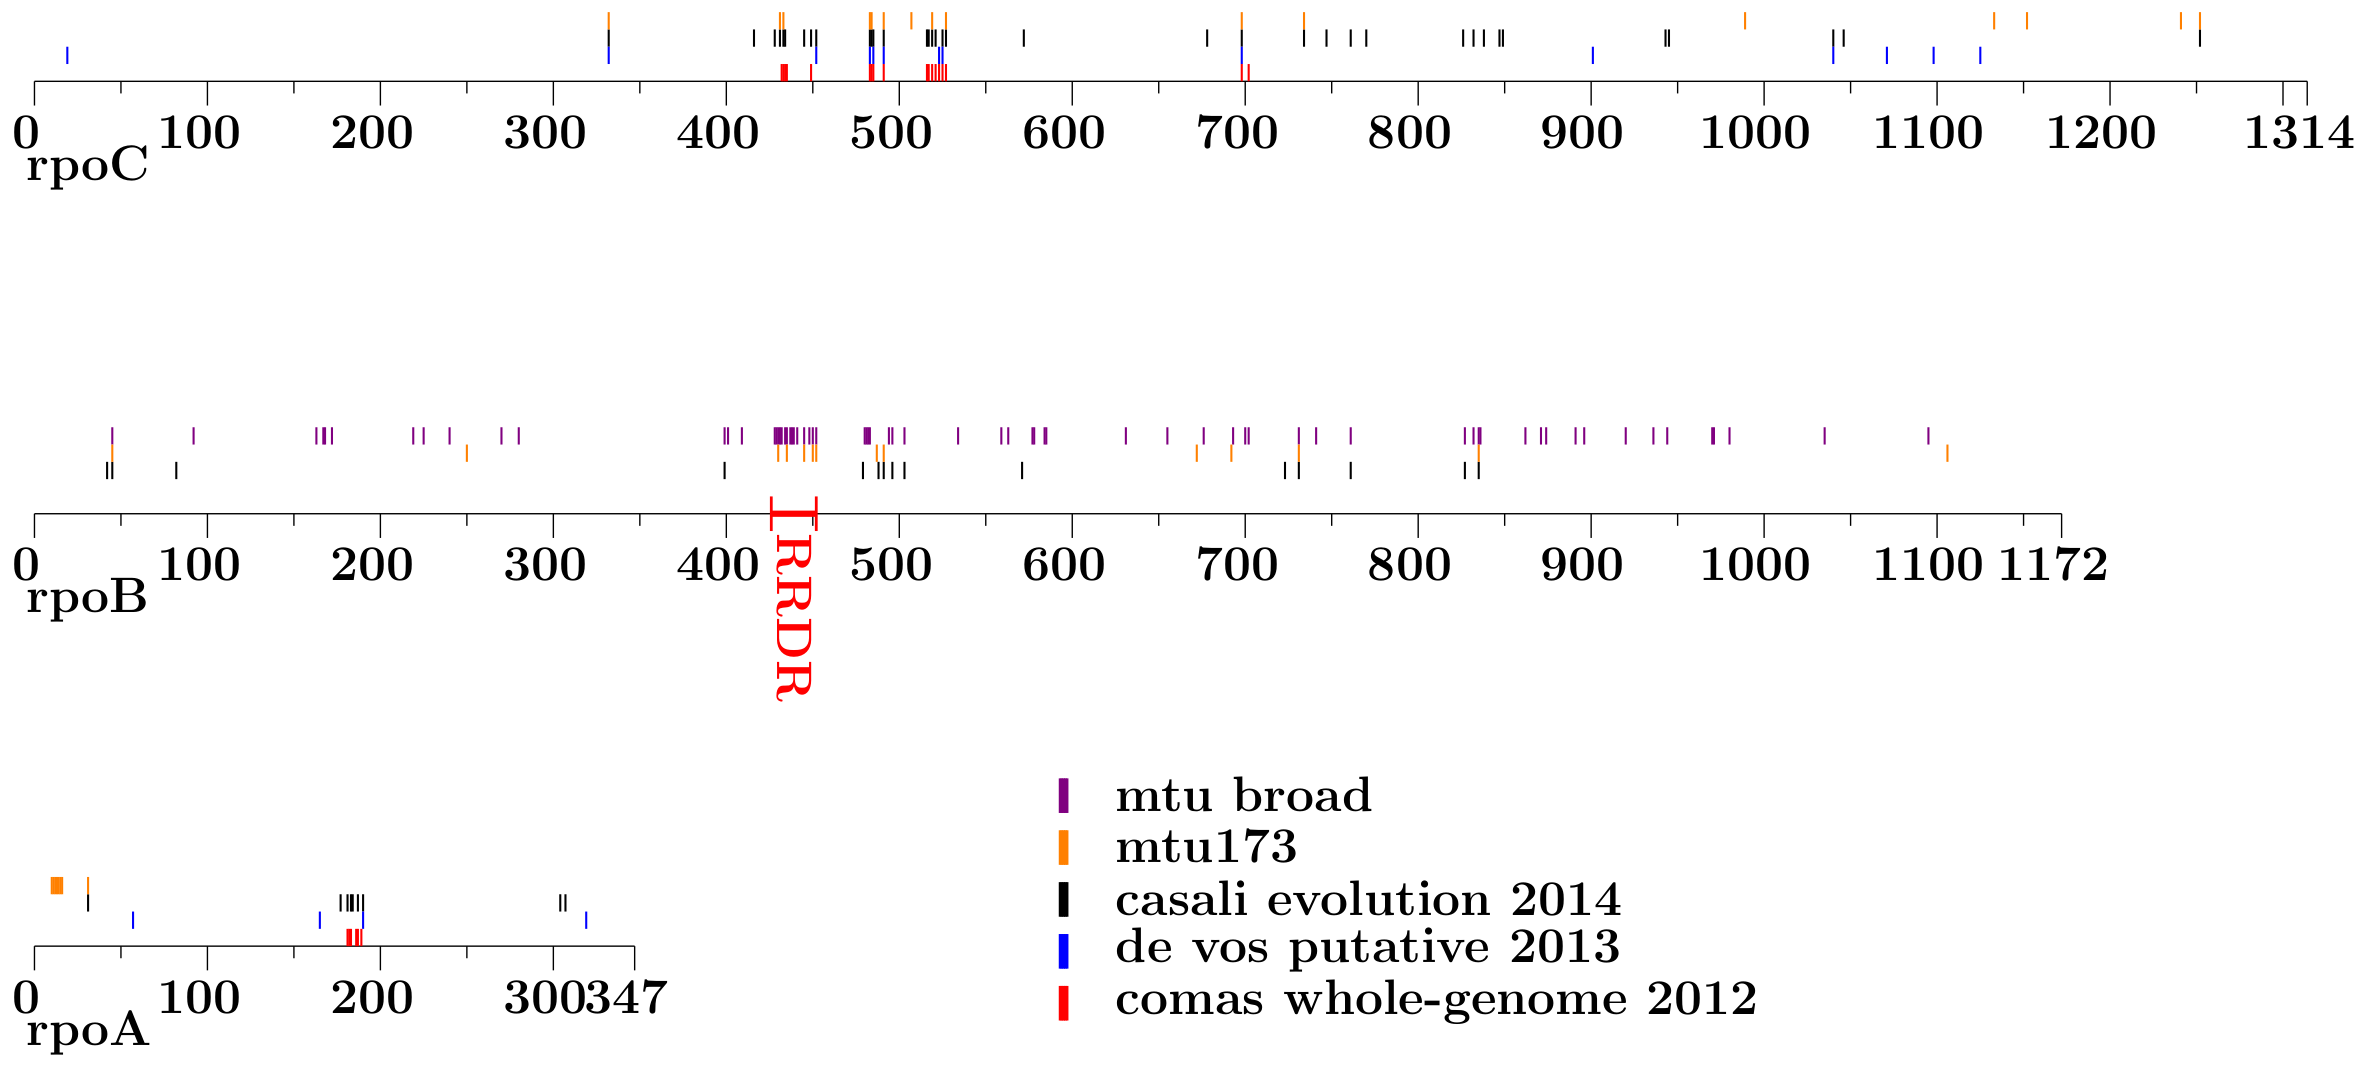
This figure (pdf) presents the
comparison of the sets of putative compensatory mutations within the rpoA,
rpoB and rpoC genes, reported in various sources and detected in our two
datasets. Each mutation's position is indicated by a vertical line of the
color corresponding to the source it was reported in. In particular orange and
violet lines indicate positions of mutations identified by our approach
applied to the mtu173 and mtu_broad datasets, respectively. The other lines
indicate mutations reported in the recent articles by Comas et al. (2012)
(red), de Vos et al. (2013) (blue) and Casali et al. (2014) (black).
- Assessment of accuracy
-
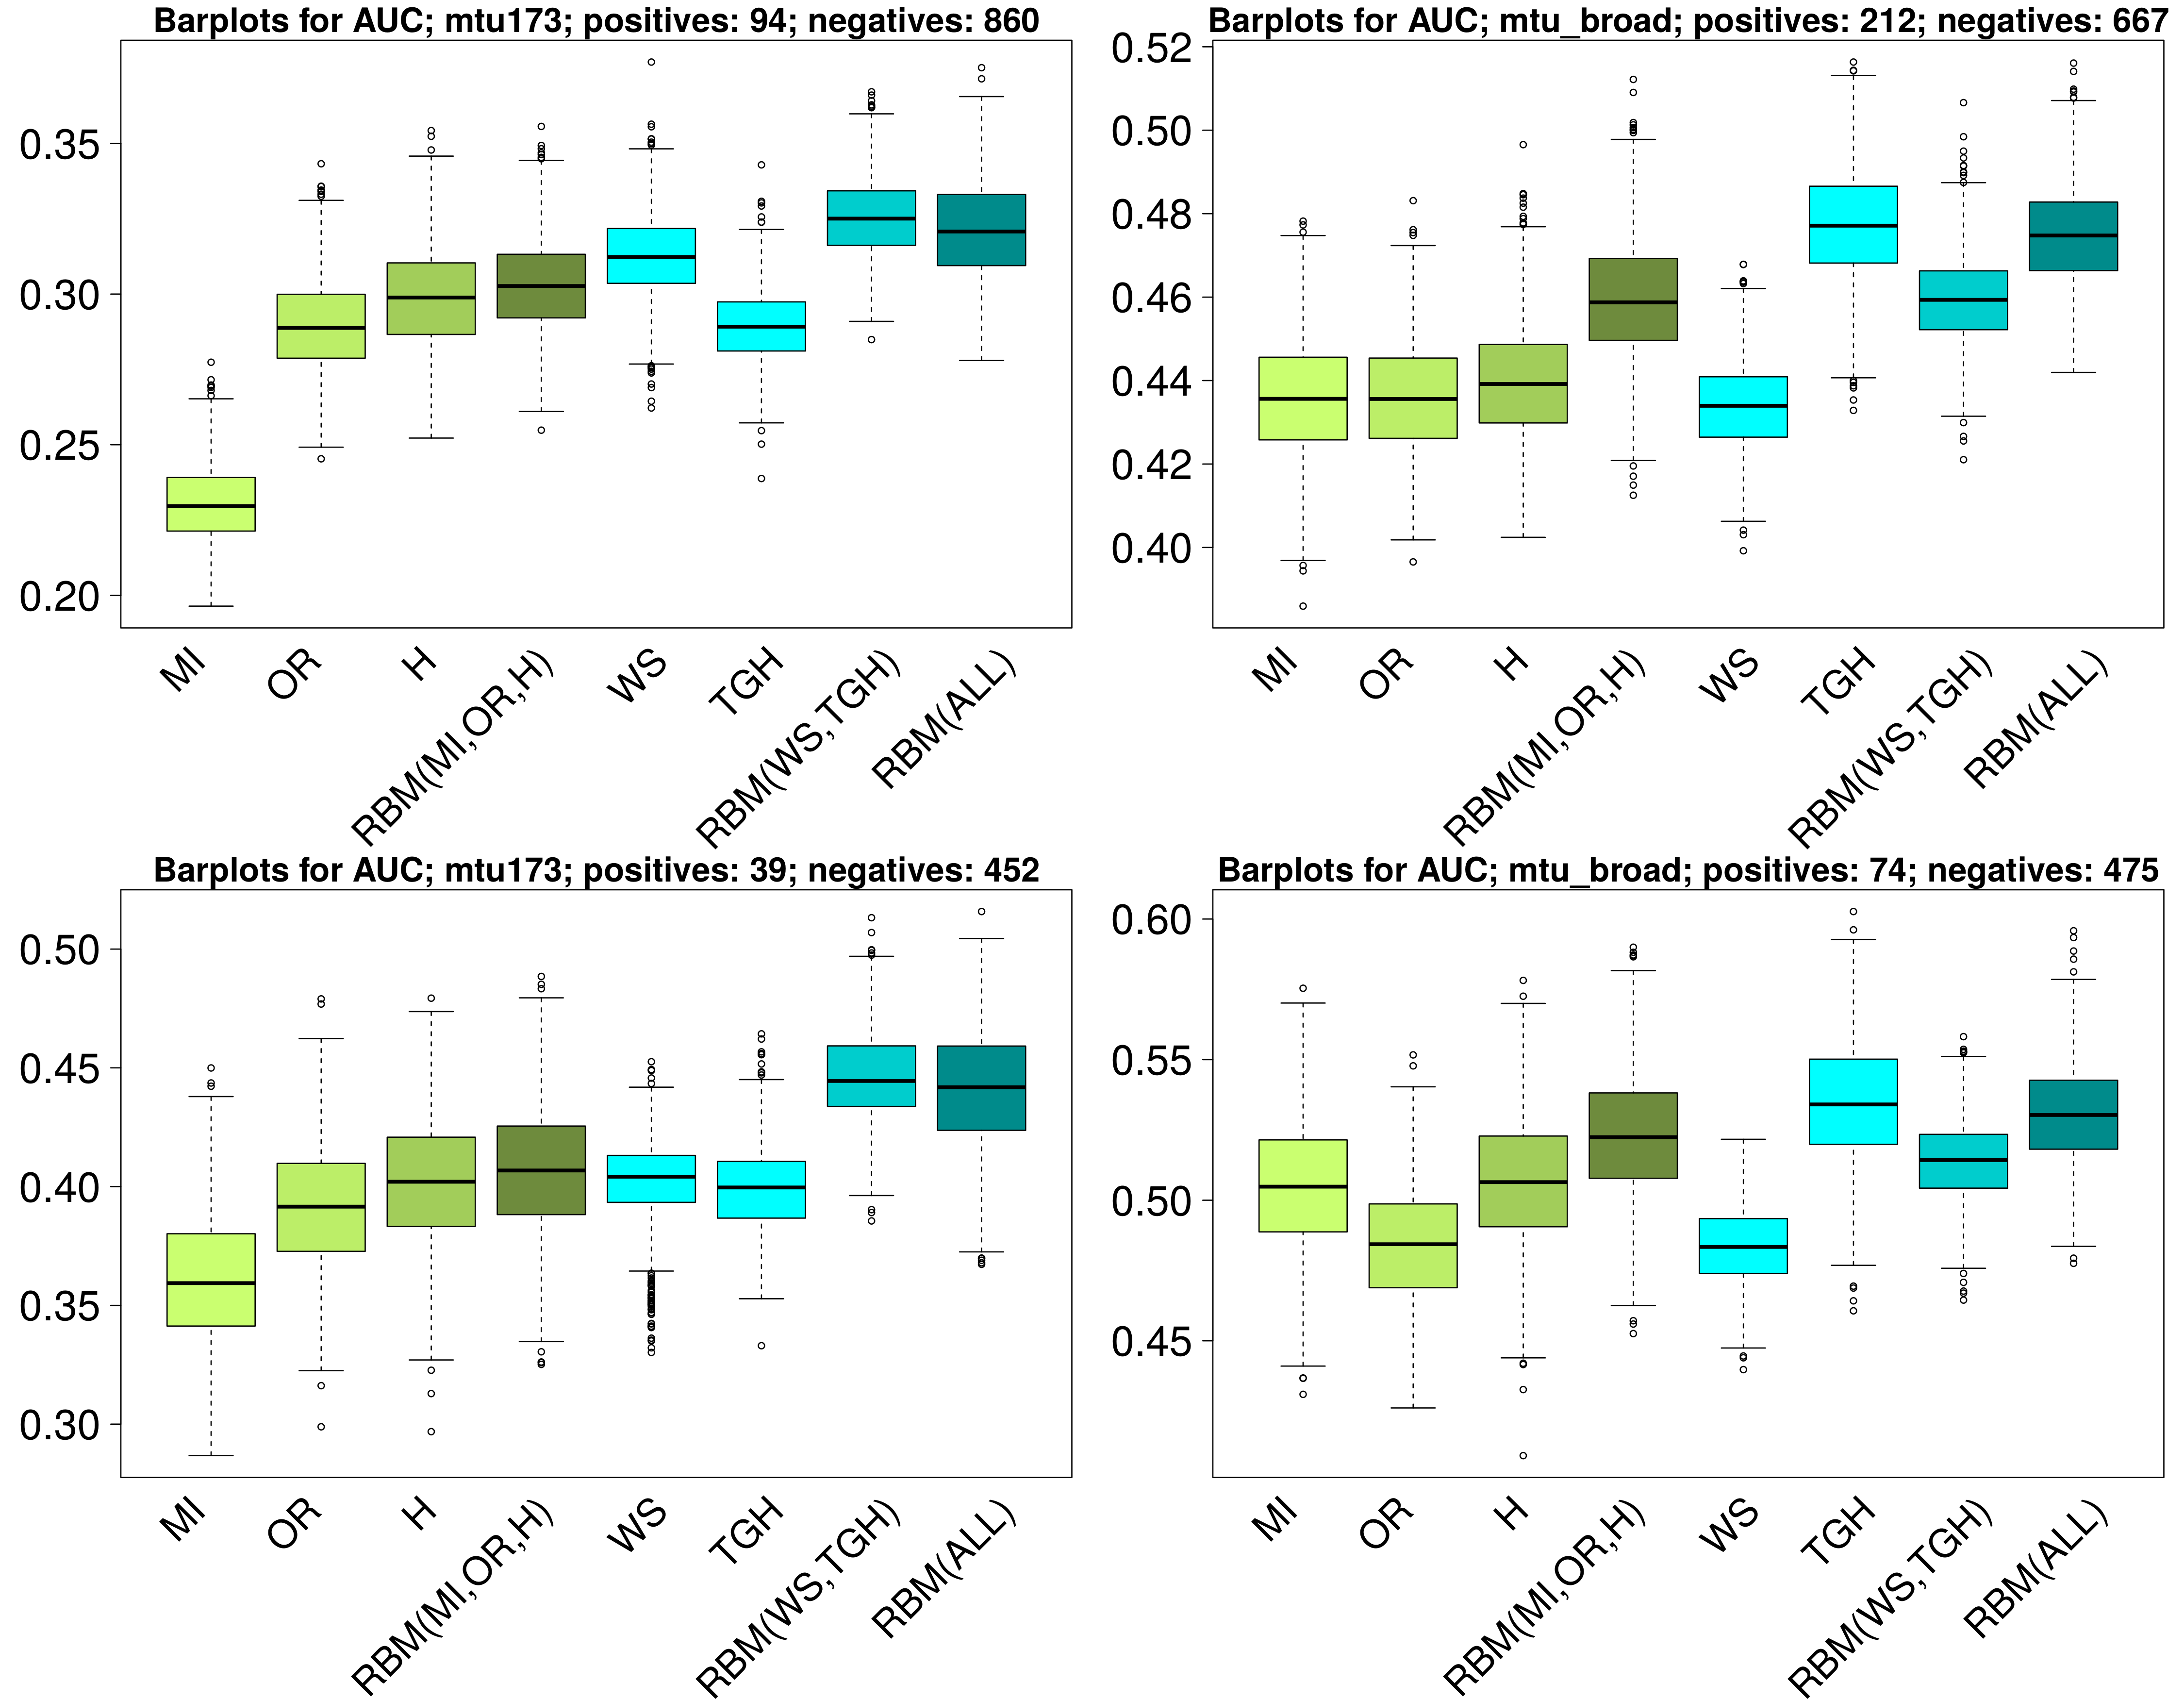
This figure (pdf) presents the comparison
of different association scores implemented in GWAMAR based on the Area Under
the Curve (AUC) statistic for the precision-recall curves. Left panels present
the results for the mtu173 dataset; right for the mtu_broad dataset. The first
row of panels corresponds to the experiments in which all associations present
in TBDReaMDB were used as the gold standard, whereas the second row
corresponds to the experiments in which only high-confidence associations were
used as the gold standard. The process of sampling the set of negatives was
repeated 1000 times. The barplots for tree-ignorant and tree-aware scores are
shown green and blue, respectively.